


Emission and zero-carbon program information
Learn about the progress we're making toward our 2030 goal of providing carbon-free power to our customers.
Data on this page will be updated within 4 weeks of the end of each quarter. This data is for informational purposes only, and should not be used for planning purposes. Data is subject to change without notice.
For data from 2023, please visit the 2023 emission and program page.
Learn about our 2030 Clean Energy Vision
2023 Zero Carbon Plan Progress Report
Quarterly generation and emissions from gas plants
| Energy generated from gas plants we control in 2024 |
|
1,661 |
--- |
--- |
--- |
We expect to generate 7,700 GWh of energy from gas plants we control in 2024.
| Gas plant emissions for load and market sales* |
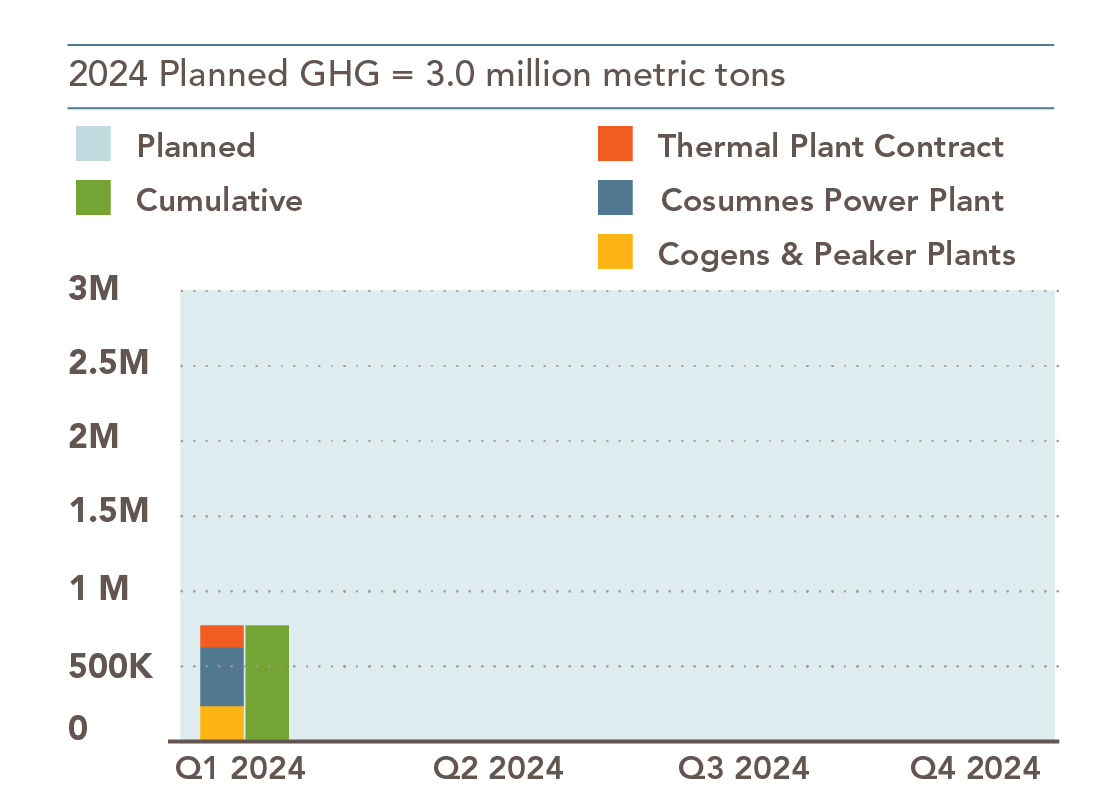
| Q1 2024 | Q2 2024 | Q3 2024 | Q4 2024 | |
| Thermal plant contract | 74k MT CO2e | --- | --- | --- |
| Cosumnes Power Plant | 423k MT CO2e | --- | --- | --- |
| Cogens and peaker plants | 139k MT CO2e | --- | --- | --- |
| Total | 636k MT CO2e | --- | --- | --- |
Note: Cosumnes Power Plant and the cogen and peaker plants are SMUD-owned resources.
*SMUD's GHG emissions are estimated based on the amount of power generated at SMUD's gas plants and power purchased from the Calpine Sutter gas plant. The planned and actual GHG emissions from our fossil fuel generation reflect total emissions to serve SMUD customer energy needs and market sales to support California and other neighboring states. GHG emissions are estimated using 2022 emissions factors, which is the most recent year that the California Air Resources Board (CARB) verified data is available for.
Solar and storage installations
| Total solar installations* |
Over 53,900 customers have installed rooftop solar, totaling more than 361 MW of energy in SMUD territory.
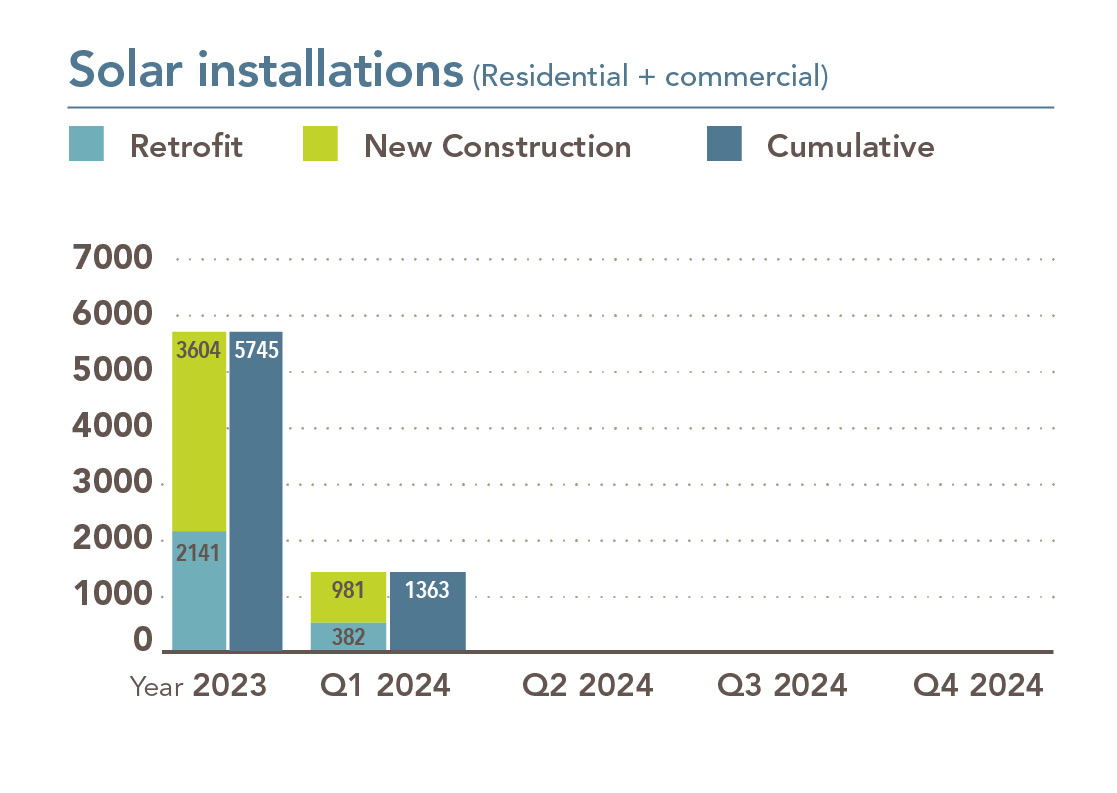
*These are completed/installed systems. SMUD has inspected the site and given approval for the system to operate.
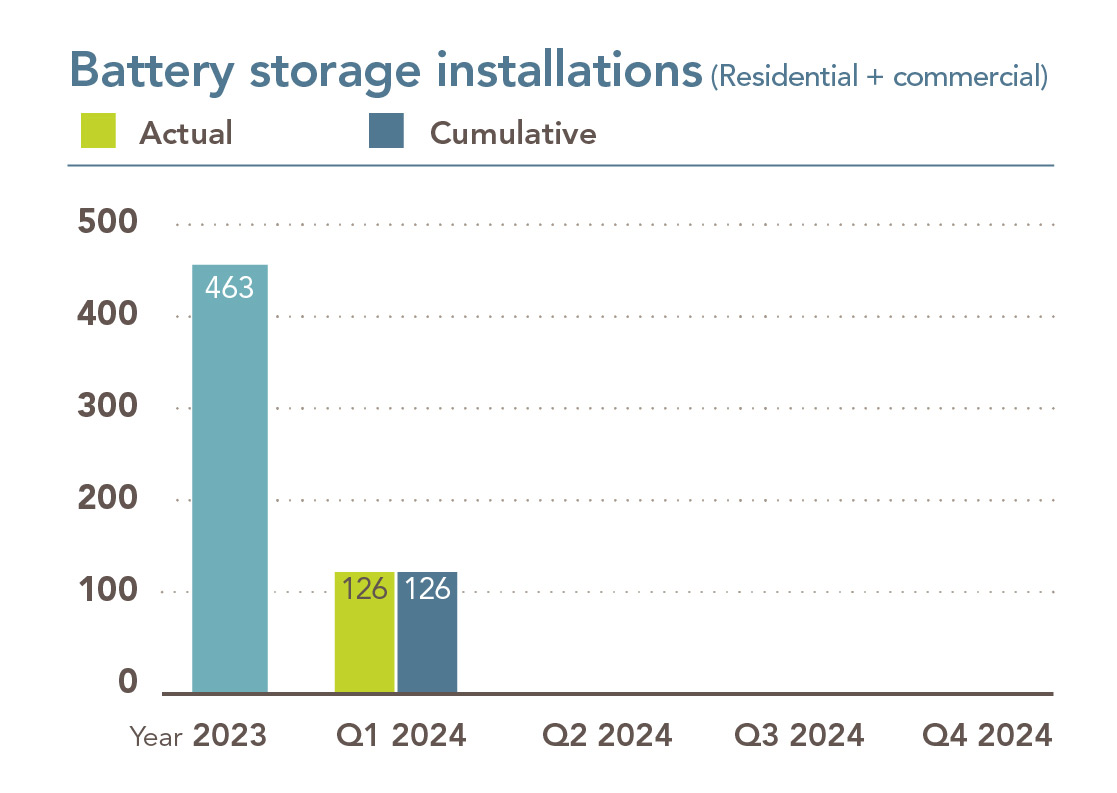
| Total battery storage installations |
Over 1,700 customers have installed battery storage, totaling more than 16 MW of storage in SMUD territory.
Zero carbon program and project statuses
We'll achieve our 2030 goal through the success of different projects, programs and activities. Utility-scale projects will help ensure we can continue to provide safe, reliable service using carbon free energy.
Participation in residential and commercial customers programs will help us bridge the gap to meet our goal and help improve our regional air quality. Program adoption depends on a variety of factors. Participation numbers may vary quarter-to-quarter depending on these factors.
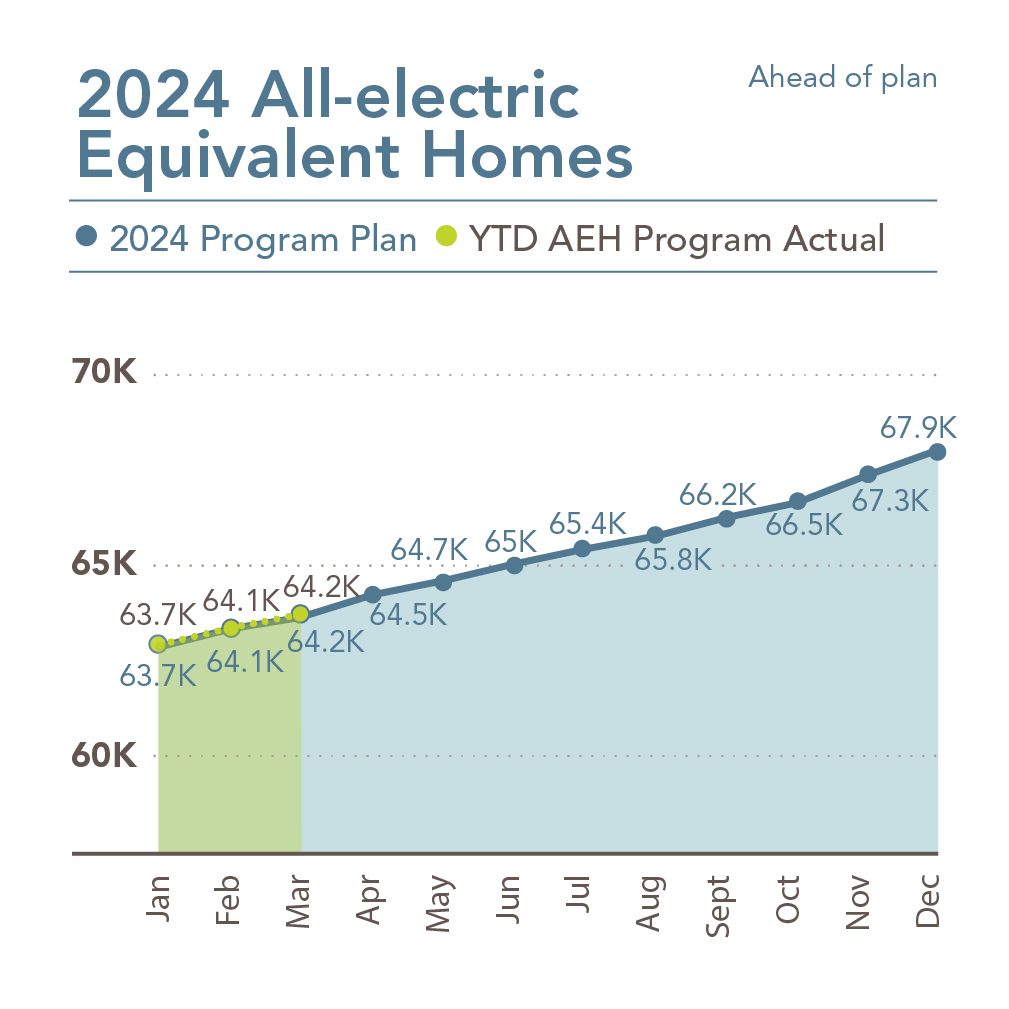
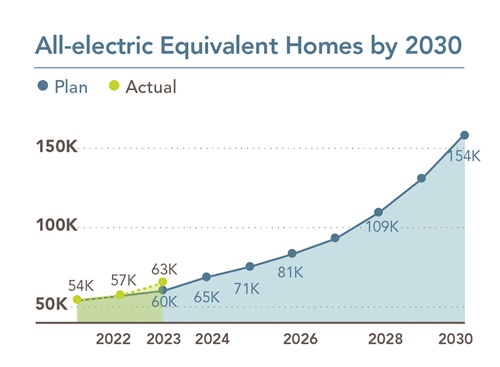
We calculate an all-electric equivalent home by combining electrification projects such as a heat pump HVAC at one home, a heat pump water heater from another home and an induction cooktop from another home. Added together, they make one all-electric equivalent home. We also include 100% all-electric single family and multifamily homes.
 |
 |
| 2023 final |
Q1 2024 |
Q2 2024 |
Q3 2024 |
Q4 2024 |
2024 goal |
|
| Heat pump HVAC conversion | 2,914 | 624 | --- | --- | --- | 3,805 |
| Heat pump water heater conversions | 940 | 934 | --- | --- | --- | 1,583 |
| Induction cooktop conversions | 386 | 92 | --- | --- | --- | 410 |
| All-electric new home & multifamily units constructed | 1,924 | 57 | --- | --- | --- | 456 |
| Multifamily units retrofitted | 1,113 | 1 | --- | --- | --- | 199 |
| All-electric equivalent homes (cumulative) | 62,890 | 64,238 | --- | --- | --- | 67,893 |
 |
 |
| 2022 final |
Q1 2023 |
Q2 2023 |
Q3 2023 |
Q4 2023 |
2023 goal |
|
| Residential EV chargers installed (rebates issued) | 5,045 | 1,170 | --- | --- | --- | 1,500 |
| Commercial EV chargers installed (rebates issued) | 367 | 63 | --- | --- | --- | 430 |
| Residential EV Rate participants (cumulative) | 23,329 | 24,601 | --- | --- | --- | 34,601 |
| E-Fuel Solutions projects | 2 | 0 | --- | --- | --- | 6 |
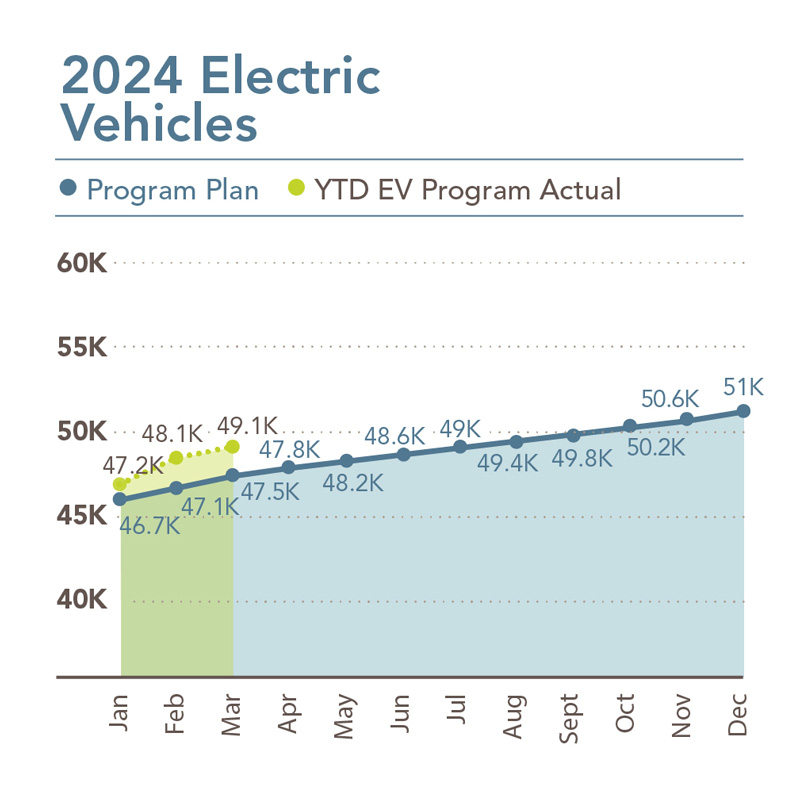
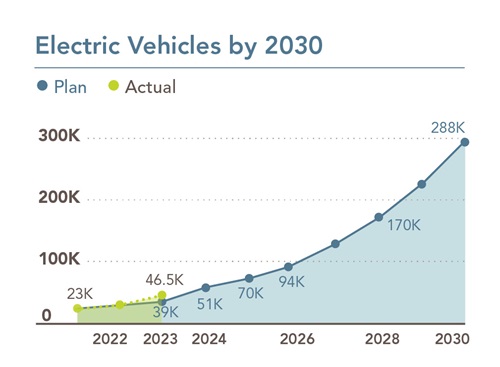
| Number of light duty EV's in service territory (cumulative) | 46,504 | 49,083 | --- | --- | --- | 51,000 |
To help us achieve our goal of carbon-free power by 2030, we're working on a variety of utility-scale projects to increase our portfolio of carbon-free energy and improve reliability. Below are projects we're currently working on or have completed.
| Status | Project name | Added capacity | Energy source | Description |
| In Progress | ESS | 4 MW/ 24 MWh |
Battery Storage |
Battery Storage pilot project in partnership with ESS, a manufacturer of long-duration iron flow batteries for utility-scale energy storage applications, will install a mix of long-duration energy storage (LDES) solutions integrated with our grid. Phase 1 pilot targets demonstrating up to 4 MW/24 MWh at our Hedge facility with 2 separate installations. The first is a 450 kW/2400 kWh storage system that was deployed in September 2023 and is undergoing operational testing. For the second installation, =design is underway for an approximately 3.6 MW/29 MWh (8-hour duration) storage system with installation planned for Winter 2025-2026. |
| In Progress | Solano 4 | 91 MW | Wind | The project scope includes decommissioning Solano 1 by removing 23 wind turbines in April 2023. The project scope also includes the installation of 19 wind turbines (9 in Solano 4 East and 10 in Solano 4 West). Construction on the new turbines started in April 2023, with expected completion in May 2024. Once the Solano 4 project is complete, SMUD Solano Assets (Solano 2, 3 & 4) will have a total installed capacity of 300 MW. |
| In Progress | Country Acres | 344 MW/ 172 MW |
Solar/Storage |
SMUD Board approved the Final EIR on April 20, 2023. Placer Planning Commission and Placer Conservation Authority Approved the Project and Mitigation Agreement on January 11 and 17, 2024, respectively. The Board of Supervisor approved the project on February 20, 2024. Construction is targeted to begin in the second half of 2024 and the project is scheduled to be online in 2026. |
| In Progress | Coyote Creek | 200 MW/ 100 MW |
Solar/Storage |
SMUD is in contract with DE Shaw for the procurement of energy for the Coyote Creek project. DE Shaw is currently in the environmental review process. The scope of the Coyote Creek project includes 200 MW Solar coupled with 100 MW x 4hr battery storage. |
| In Progress | Sloughhouse | 50 MW | Solar | SMUD is in contract with DE Shaw for the procurement of energy for the Sloughhouse project. The scope of the project is a 50 MW solar installation. Design, environmental review and permitting are in progress. The project is forecasted to be completed in mid-2025. |
| Complete (2023) | Hedge | 4 MW | Battery Storage | Commercial operation of the Hedge Lithium Ion Battery Energy Storage System began in January 2023. The system will provide 4 MW of electricity and 8 MW-hours of storage that can be tapped when other energy resources are strained—enough to power 800 homes for 2 hours with clean, renewable energy. |
| Complete (2023) | Calpine | 100 MW | Geothermal | January 2023 marked the beginning of the 10-year PPA of energy from Calpine’s operations at The Geysers, which adds 100 MWs of geothermal energy to SMUD’s portfolio—enough to power about 100,000 homes for a year. The Geysers is the single largest geothermal electric operation in the world. |
| Complete (2022) | Drew Solar | 100 MW | Solar | The Drew Solar Project, completed in 2022, is a 30-year Power Purchase Agreement (PPA) for 100 MW Solar. Located in Imperial County, it has an expected output of 282,000 MWh/year. |
Want to learn more about how much power our customers are using and where the power is coming from.